The 2022 UCL Final is in the books but soccer fans don’t really have that long to wait for more amazing soccer. Ukraine just beat Scotland 3–1 to advance to another World Cup Qualifying match against Wales and the USMNT beat Morocco 3–0 in Cincinnati. Soccer doesn’t stop!
During last Saturday’s UCL final, Liverpool seemed to put shot after shot on goal, only to be stymied by Real Madrid keeper Thibault Courtois, who seemingly stretched his already massive 6'7" frame across the entire goal on a near constant basis. Liverpool’s xG in that game was over 2, while Real Madrid’s was around 0.8. The xG stats in this game give the impression that Liverpool was simply unlucky and that Real Madrid’s defense wasn’t doing Courtois any favors. This got me thinking about other UCL finals and how teams defend in those games.
The UCL final is the last game of the soccer season and the teams that play in that game have already had a long season. Liverpool literally played in the maximum number of games at Premier League team could play in — 63! Real Madrid played ten less games at 52 matches across all competitions. At the end of a season as long as these two teams have had, does this in any way change the strategy and tactics coaches employ? Right now, I don’t have the data to answer that question.
But with StatsBomb’s free soccer data, I can examine how teams that have played in the UCL final since 2000 have defended compared to the cumulative average across all teams playing the final game of the soccer season. Using the Champions League Final data that’s available (there’s a few years missing), I examined how the teams in those final games make a certain percentage of their defensive actions in certain zones across the pitch, and then compared each team’s percentage to the UCL final average.
I cut the pitch up into bins and then found the amount of defensive actions each team performs in each of those bins. To find the average of all defensive actions taken in every UCL final game I have data for, it’s simply totaling all defensive actions by all teams and then dividing each team’s defensive actions in each bin by the cumulative defensive actions across all games. If that’s a little confusing, it’s probably because I didn’t explain it that well, but hopefully it will make sense once you see the visualization. Here it is:
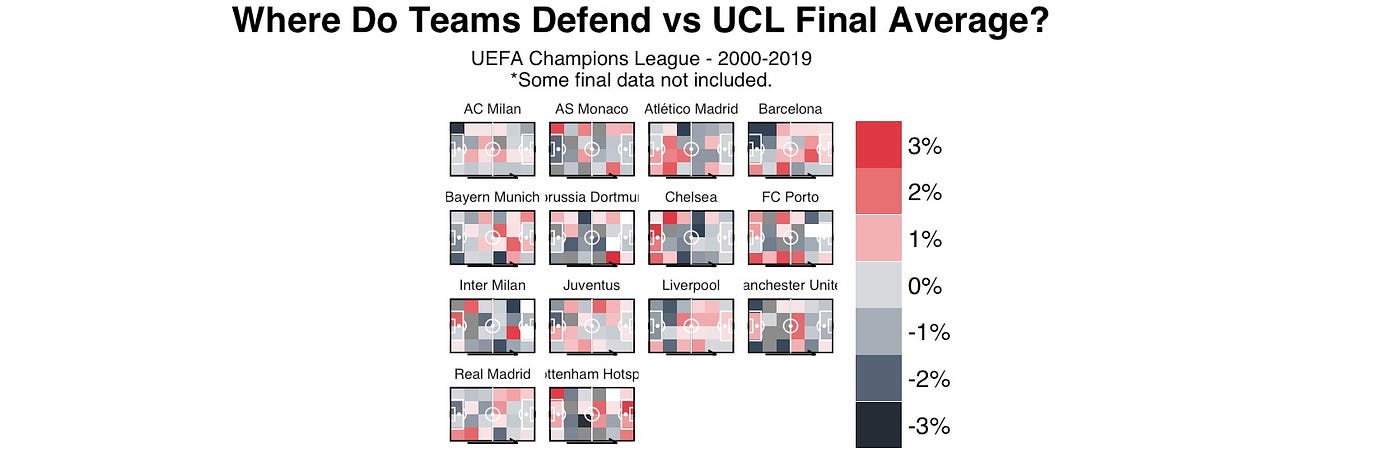
Ok — so it’s a little difficult to see. But bins that are light to dark red indicate that the team had more defensive actions than the average, while light to dark gray bins mean that a team had less defensive actions in that bin than the average. It’s also hard to see, but there’s arrows underneath every pitch that indicate the direction of attacking play. Look at the 4 teams on top of the picture — AC Milan, AS Monaco, Atletico Madrid and Barcelona. You can tell that Atletico Madrid tend to sit back in their half of the pitch defensively, while Barcelona tends to press forward and has a higher average number of defensive actions in their offensive half. Liverpool is a bit more balanced, having higher than average defensive actions in both halves.
I did this analysis in R, and it was good to practice using StatsBomb data in that program rather than Python, which is how I’ve usually worked with StatsBomb data. I’ll link to my GitHub below. Any feedback, questions, or ideas for future projects are most welcome!