I know the last post was about some soccer data and now I’m hooked. I’ve been reading articles about expected goals (xG) and how to model them and I decided to take a stab at it with some EFL League 2 data. Maybe a little less pressure than using the Premier League Table? I’ll put a little more emphasis on Leyton Orient because I like the phrase “Up the O’s!” Apparently this is a saying about the team.
A very useful package I’ve found is worldfootballR and goalmodel. I used goalmodel for these predictions, and followed the awesome tutorial that’s on the Github page (https://github.com/opisthokonta/goalmodel). This is the first time I’ve created a predictive model for sports and so I simply followed the tutorial but changed the code so that I used EFL League 2 scores.
I’m still learning the maths behind this awesome package, so my goal is to one day develop a model of my own. But what goalmodel essentially does is model goal scoring intensity of teams so that it’s a function of teams’ attack and defense ratings. What the model needs, at bare bones, are the names of the teams and the number of goals scored. I’m using this current season of EFL League 2, which is only 5 weeks in. I’m sure that there’s not really enough data to have an accurate prediction of how the league table will eventually end up, so I’m also planning to continuously update the model and maybe even use the last two seasons as a sort of training dataset to increase the fit of the model.
Let’s get into some of the code I used to get the data and clean it in a way that would be useful.
First, I wanted to get a look at the current standings for EFL League 2. The resulting dataset also includes how many matches have been played, how many wins each squad has, and some additional goal scoring information. This will be important for the model I’ll make later.
EFL_L2_seasonstats2022 <- get_season_team_stats(country = "ENG", gender = "M",
                                            season_end_year = "2022",
                                            tier = "4th",
                                            stat_type = "league_table_home_away")
Now I have total season stats for all matches played so far. Let’s see what the table looks like. I’ll only show the top 10 for the 2021–22 season thus far.
EFL_L2_seasonstats2022 %>%
  select(Squad, Rk) %>%
  arrange(Rk) %>%
  head(10)
            Squad Rk
1       FG Rovers  1
2       Harrogate  2
3   Bradford City  3
4    Swindon Town  4
5  Hartlepool Utd  5
6   Leyton Orient  6
7  Mansfield Town   7
8     Northampton  8
9       Stevenage  9
10      Port Vale 10
Right now, the data frame that has the full stats for the season has them split up into Home and Away — i.e. W_Home is how many wins the team has at home, GF_Home is how many goals the team has scored at home. This is useful, but what I want to add are totals for Wins, Losses, Goals For, Goals Against and Goal Differential. I’ll keep the columns that separate the stats into home and away but I want columns that make it easy to see the totals.
EFL_L2_seasonstats2022 <- EFL_L2_seasonstats2022 %>%
  mutate(Total_Wins = W_Home + W_Away,
         Total_Draws = D_Home + D_Away,
         Total_Losses = L_Home + L_Away,
         Total_Goals = GF_Home + GF_Away,
         Total_Goals_Against = GA_Home + GA_Away,
         Goal_Diff = Total_Goals - Total_Goals_Against)EFL_L2_seasonstats2022 <- EFL_L2_seasonstats2022 %>%
  mutate(Points = (Total_Wins * 3) + (Total_Draws * 1))
I kept all the original columns but added 7 other columns at the end. Now I’ll take a closer look at the table using these new columns and see if they match up with the rankings from earlier.
EFL_22_stats %>%
  arrange(desc(Points)) %>%
  select(Squad, Points) %>%
  head(10)Squad Points
1        FG Rovers     12
2    Bradford City     10
3        Harrogate     10
4     Swindon Town     10
5   Hartlepool Utd      9
6    Leyton Orient      8
7   Mansfield Town       7
8      Northampton      7
9        Stevenage      7
10 Carlisle United      6
Although this ranking is different from the one above, it’s because Bradford City, Harrogate and Swindon Town all have the same number of points and R arranged them alphabetically. Let’s take a look at how total goals for and against, along with goal differential shake out for the top 10.
EFL_22_stats %>%
  arrange(desc(Points)) %>%
  select(Squad, Total_Goals, Total_Goals_Against, Goal_Diff, Points) %>%
  head(10)Squad               Total_Goals Total_Goals_Against Goal_Diff Points
1        FG Rovers          13                   8         5     12
2    Bradford City           9                   6         3     10
3        Harrogate           8                   4         4     10
4     Swindon Town           6                   3         3     10
5   Hartlepool Utd           7                   4         3      9
6    Leyton Orient           7                   4         3      8
7   Mansfield Town            7                   7         0      7
8      Northampton           3                   3         0      7
9        Stevenage           5                   6        -1      7
10 Carlisle United           4                   4         0      6
So FG Rovers, atop the table right now at this point in the season, lead in both goal differential and points, which is to be expected. They also have scored 4 more goals than Bradford City, the next closest team, but have also conceded the most goals of teams in the top 10 so far. I suspect they may have a bit of a leaky defense. The rest of the top 10 shakes out about how I would expect.
I want to visualize how the EFL table looks when comparing their points and goal differentials.
ggplot(EFL_22_stats, aes(x = Goal_Diff, y = Points, label = Squad)) +
  geom_point(color = "red") +
  xlab("Goal Differential") +
  ylab("Points") +
  labs(title = "EFL League 2 Table") +
  geom_text_repel()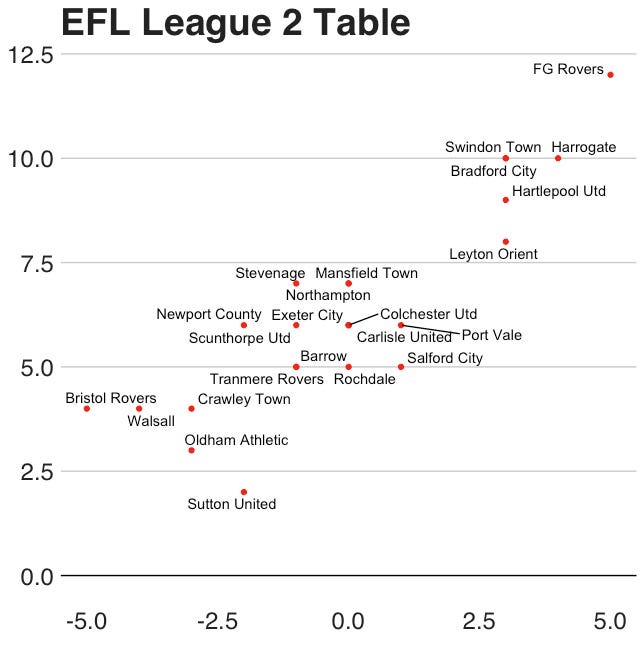
We can see there’s a solid cluster of teams between 5 and 7.5 points and between a -2.5 and 2.5 goal differential. The graph makes it easy to see that the top 6 teams in League 2 could really separate themselves in the coming weeks.
Now comes the part where I may embarrass myself…I’m going to use goalmodel to create some predictions for the rest of the League 2 season. Like I said earlier, I’m still working out the maths for these types of models and one day my goal is to build my own without assistance from a package. But for now I’m going to use this to learn and see what I can find out.
One of the functions I’ll be using is called “goalmodel”, the same name as the package I’ve been using. It models goal scoring intensity using the amount of goals scored and goals allowed of the teams. Admittedly this is a small sample size and it being early in the season, likely not incredibly accurate or indicative of future performance. First, I’m going to use the default model of the package.
I created a new data set that only includes all the matches that have been played so far. This gives me the necessary requirements to use the model function. Then I use “goalmodel” to create a generic model.
EFL_2021_played <- EFL_match_results_3 %>%
  filter(Wk <= 5)
EFL_2021_played <- EFL_2021_played %>%
  na.omit(EFL_2021_played)EFL2_model <- goalmodel(goals1 = EFL_2021_played$HomeGoals, goals2 = EFL_2021_played$AwayGoals,
                    team1 = EFL_2021_played$Home, team2 = EFL_2021_played$Away)summary(EFL2_model)Model sucsessfully fitted in 0.01 secondsNumber of matches            55
Number of teams              24Model                     PoissonLog Likelihood            -129.36
AIC                        354.71
R-squared                  0.34
Parameters (estimated)       48
Parameters (fixed)            0Team                      Attack   Defense
Barrow                    -0.20     0.17
Bradford City              0.47    -0.15
Bristol Rovers            -0.39    -0.74
Carlisle United            0.20     0.39
Colchester Utd            -0.28     0.20
Crawley Town              -0.01    -0.08
Exeter City               -0.04     0.38
FG Rovers                  1.17    -0.83
Harrogate                  1.07     0.07
Hartlepool Utd             0.72    -0.22
Leyton Orient              0.52     0.65
Mansfield Town              0.12    -0.40
Newport County            -0.38    -0.27
Northampton                0.06     0.07
Oldham Athletic           -0.41    -0.54
Port Vale                 -0.62     1.16
Rochdale                   0.14     0.19
Salford City               0.40     0.07
Scunthorpe Utd             0.05    -0.38
Stevenage                 -0.00    -0.44
Sutton United             -0.53    -0.06
Swindon Town               0.23     0.47
Tranmere Rovers           -1.48     0.63
Walsall                   -0.81     0.00
-------
Intercept                 -0.09
Home field advantage       0.04
The top 10 teams in League 2 are in bold, along with their Attack and Defense ratings. This is what the model will use for predicting the outcome of matches. It’s interesting to see that FG Rovers, despite being the top team in the league, has the worst Defense rating out of all the teams. The Home field advantage rating is given to team1 in the model, which is the home team.
Now, what’s the point of having a predictive model if you can’t make some predictions with it? Luckily goalmodel comes with some handy functions to make several predictions and output the result in a nice little data frame for further analysis.
First I’ll look at the Expected Goals generated from the model.
predict_season1 <- c(unplayed_EFL_games$Home)
predict_season2 <- c(unplayed_EFL_games$Away)EFL2_model <- goalmodel(goals1 = EFL_2021_played$HomeGoals, goals2 = EFL_2021_played$AwayGoals,
                    team1 = EFL_2021_played$Home, team2 = EFL_2021_played$Away)EFL_L2_Pred$Wk <- unplayed_EFL_games$Wkcol_order <- c("Wk", "team1", "team2", "expg1", "expg2")EFL_L2_Pred <- EFL_L2_Pred[, col_order]
I created a data frame that included all the unplayed fixtures for the rest of League 2 season. I assigned the Home games to the predict_season1 variable and the Away games to the predict_season2 variable. Then, I assigned the EFL2_model to the actual function that will model the expected goals. The data frame that’s generated doesn’t have the week of the matches so I added that from the unplayed_EFL_games data frame. Then I ordered the columns to make a little more sense. Let’s take a look at the expected outcomes for Week 6.
EFL_L2_Pred %>%
  filter(Wk == 6)Wk           team1          team2     expg1     expg2
1   6   Bradford City        Walsall 1.5263992 0.4786214
2   6     Exeter City      FG Rovers 2.1071433 2.0331495
3   6 Oldham Athletic         Barrow 0.5359346 1.2877314
4   6  Mansfield Town      Harrogate 1.0020996 4.0052352
5   6       Stevenage   Swindon Town 0.5977011 1.7943734
6   6       Port Vale       Rochdale 0.4294908 0.3306406
7   6 Tranmere Rovers Hartlepool Utd 0.2696606 1.0023774
8   6     Northampton Scunthorpe Utd 1.4775007 0.8982173
9   6  Colchester Utd  Sutton United 0.7700193 0.4400964
10  6 Carlisle United   Salford City 1.0891702 0.9228864
11  6  Bristol Rovers   Crawley Town 0.7005184 1.9067104
12  6  Newport County  Leyton Orient 0.3434896 2.0386526
The first thing that jumps out to me is that the model predicts that Exeter City to have more expected goals than the table leader, FG Rovers. Not by much however. I’d advise against watching the Port Vale and Rochdale game, also, unless you like 0–0 draws. Harrogate has the highest expected goal total for Week 6, as well as the largest projected goal differential.
The matches are tomorrow, so by the end of the day we’ll know for sure how well the model has performed. I’ll be updating this continuously throughout the season, and I’m really interested to see how this performs. I think next week, I’ll predict out the whole season, complete with standings and see how it holds up throughout the year. Stay tuned!